Trend detection
Newcastlesys calculates rolling 7-day, 30-day, and 90-day trend lines for every metric in your dataset. When a trend changes direction, you see it charted with the inflection point marked — not buried in a table of raw numbers.

Analytics
Newcastlesys analytics goes beyond reporting — it surfaces trends, forecasts, and anomalies so you can act before the problem grows.
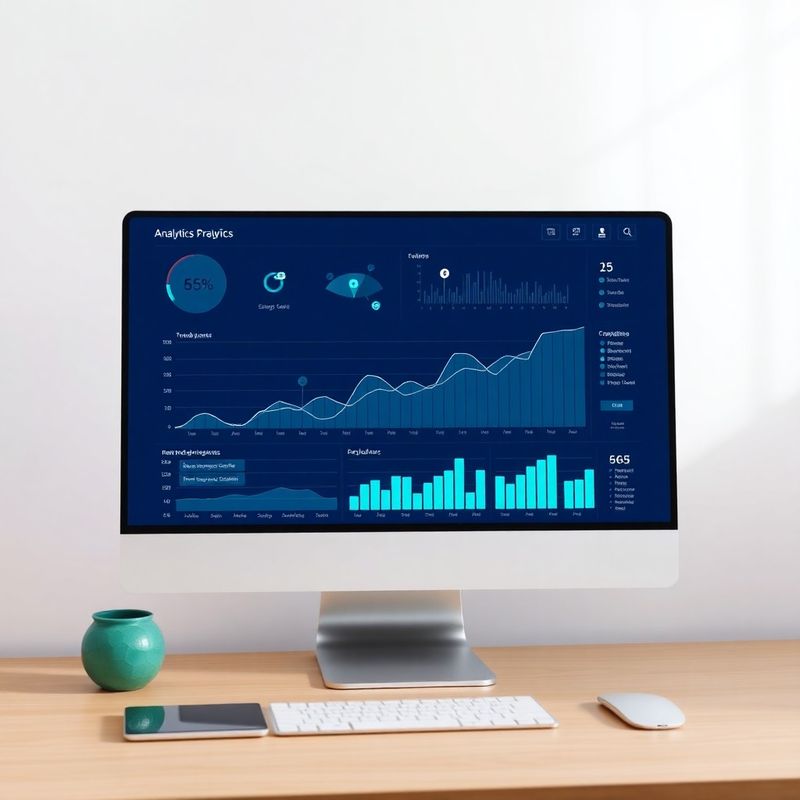
Newcastlesys analytics is not a BI tool that requires a data analyst to run. It's a set of automated analysis pipelines that run on your connected data and deliver outputs directly to the people who need them. Concretely, you get: rolling trend lines on every key metric, cohort breakdowns for customer retention analysis, revenue forecasts based on the last 90 days of actuals, and anomaly detection that compares today's performance against a seasonally adjusted baseline. Outputs arrive as interactive charts in your dashboard, as scheduled email digests, and as Slack alerts when something moves outside normal range. The system works on the data you've already connected — no additional setup, no SQL, no separate data warehouse required.
Newcastlesys calculates rolling 7-day, 30-day, and 90-day trend lines for every metric in your dataset. When a trend changes direction, you see it charted with the inflection point marked — not buried in a table of raw numbers.
Segment customers by acquisition month, product line, or geography and compare their lifetime value, churn rate, and purchase frequency across cohorts — without writing a single query.
A 60-day forward revenue forecast, generated weekly, based on your actual closed deals, subscription renewals, and seasonal patterns. Delivered as a chart and a confidence-range summary in your dashboard.
When a metric deviates more than two standard deviations from its rolling baseline, Newcastlesys flags it and sends an alert — before the issue compounds. You define which channels get notified.
“I'm not a data person — I run a 12-person services firm in Adelaide. Newcastlesys analytics started flagging a slow drop in our repeat-client rate about six weeks before I would have noticed it in my invoices. We changed our follow-up process and turned it around. That alert probably saved us $40,000 in annual revenue.”
Callum Reid, Director, Adelaide
Newcastlesys analytics is built for pattern detection and operational intelligence, not for exploratory data science or ad-hoc SQL queries. If your team needs a full data warehouse, custom ML models, or deep statistical modelling, you'll want a specialist analytics engineering firm alongside us — and we're happy to refer you to one. Our forecasts use time-series methods calibrated to typical SMB data volumes; they are directional guides, not auditable financial projections. We say this plainly because misleading a business owner with false precision does more harm than saying “we see a downward trend — investigate this week” and leaving the inference to you.
Connect your data sources and let Newcastlesys run its first analysis — usually within a few hours of setup.